🚀 Wrangling Space Data

- Space and rockets are cool!
- AI is cool!
- Data engineering is cool!
So what could be cooler than combining the them!?
Companies like Glint Solar, DHI GRAS, and Lumen Energy use satellite images combined with artificial intelligence to make a positive impact on the world.
Using Convolutional Neural Networks (CNNs) and other techniques, they can evaluate if a location is suitable for a solar panel installation, even if the site is on the water in the case of Glint Solar! DHI GRAS has a wide range of remote sensing capabilities applied on wind farms, urban planning, and much more.
🛰️ Bigearth.net and Sentinel 2
Bigearth.net is a dataset that contains pre-labeled satellite images from the Sentinel 2 satellite and is freely available. Kudos to G. Sumbul, M. Charfuelan, B. Demir, and V. Markl for the work they put into this!
Sentinel 2 takes photos of the earth in 13 spectral bands. Each of the bands has properties that can be more or less relevant for a given application. One such application is measuring the amount of vegetation. In this case, the sensors that capture wavelengths between 704.1 and 782.8 nanometers are suitable.
Bigearth.net is available as a TensorFlow dataset. But you only have the choice of getting the red, green, blue bands; or all the bands.
Out of nerdy curiosity, I decided to build an Apache Beam pipeline that would allow the user to create a TFRecord data set with an arbitrary combination of bands.
🏆 The Goal
A data pipeline generally has one or more systems that consume the results it produces. I decided that the destination of the data should be a binary classification CNN. I wanted the model to have a practical application and settled on a target CNN that can differentiate between images with or without water in them.
A model that can find water in satellite images is applicable for both floating solar and wind farms. Maybe even to find water on other heavenly bodies!?
🌍 Prepping the Data
Before the actual data-wrangling could begin, I needed to make it available for the pipeline. I did that with the following steps:
- Download the dataset
- Unpack and upload into a Google Could Storage Bucket
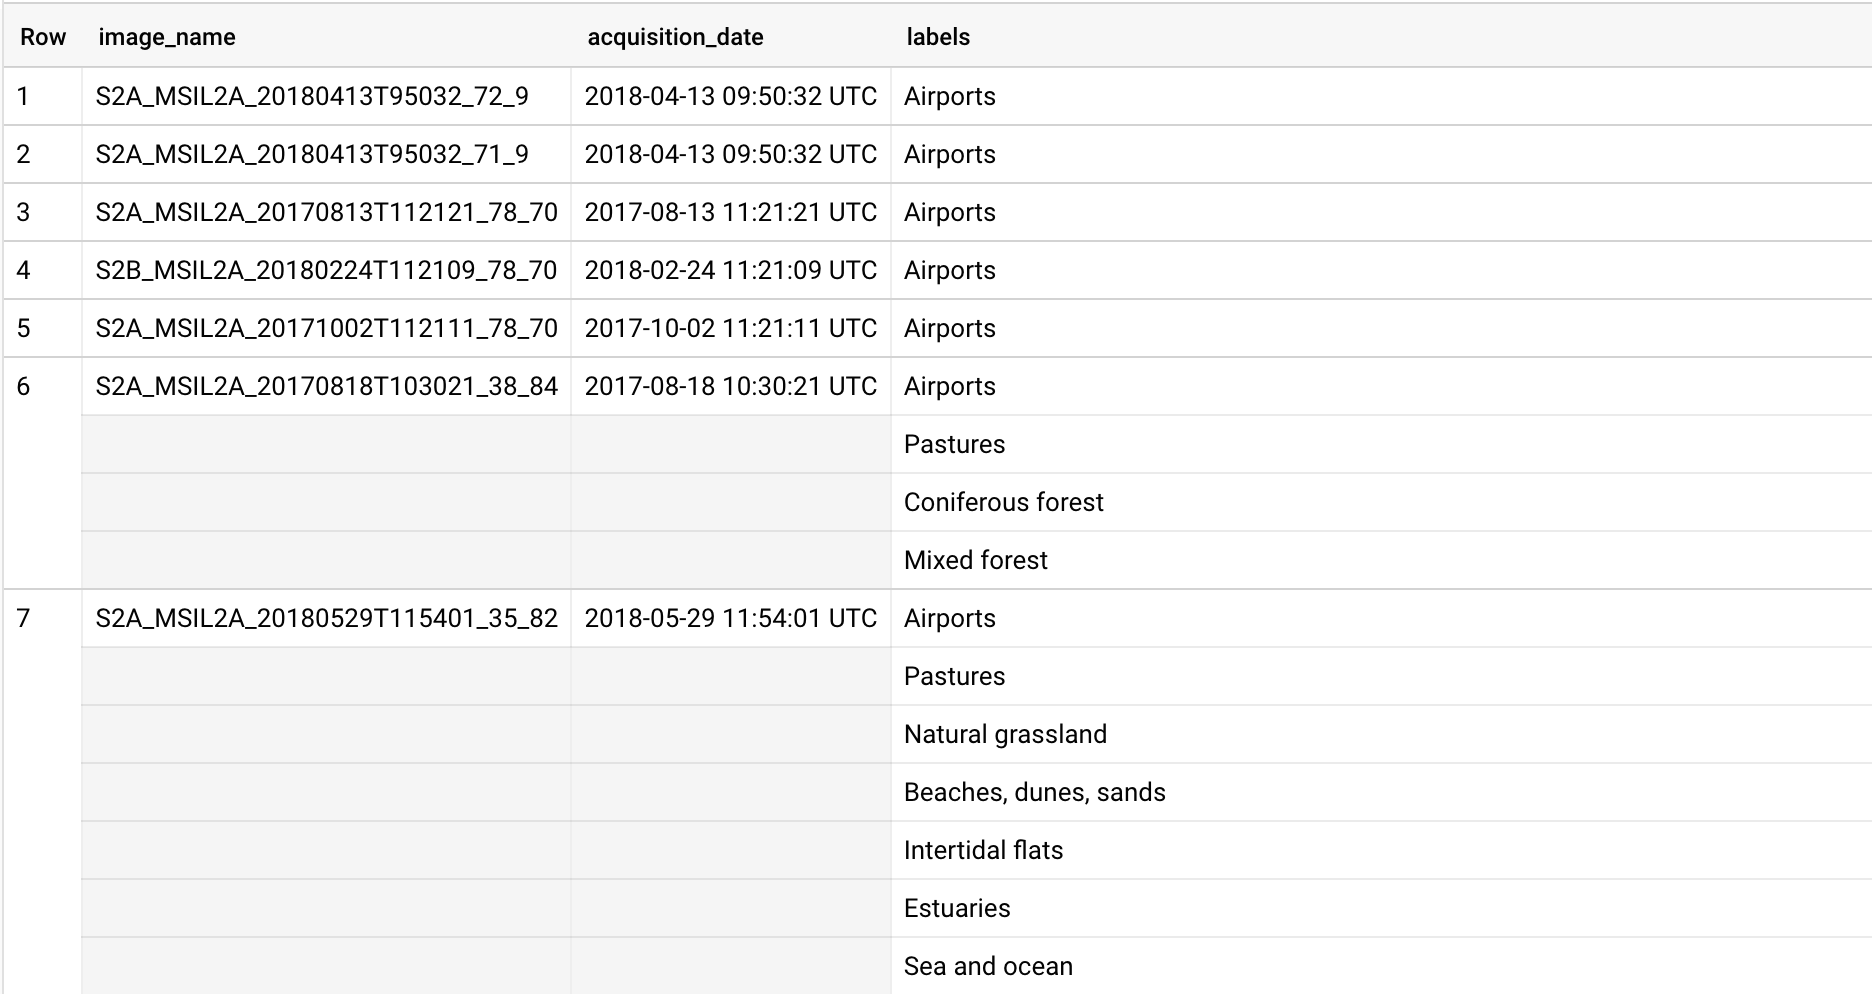
- Create a BigQuery table with the image locations and metadata
I downloaded the full dataset to my laptop and streamed the decompressed content to my bucket.
I also used Apache Beam to get the data into BigQuery, The gist of it looks like this:
Now I could query the image names, acquisition dates, and labels to my heart's content. One main reason for using BigQuery is making re-creatable datasets using the FARM_FINGERPRINT hash function.

🕳️ The pipeline
Before the CNN can learn from the satellite images, we have to transform them into a suitable format. They also need to be labeled in a way that makes sense for the application of the resulting model. Using the pre-existing labels, I derived a new binary label: `has_water` by making two views:
has_water:
SELECT
  image_name,
  acquisition_date,
  labels FROM {TABLE}
WHERE ('Water bodies' in UNNEST(labels) OR 'Sea and ocean' in UNNEST(labels))
no_water:
SELECT
  image_name,
  acquisition_date,
  labels FROM {TABLE}
WHERE NOT ('Water bodies' in UNNEST(labels) OR 'Sea and ocean' in UNNEST(labels))
💪 Flex Template
To make the pipeline as reusable as possible, I implemented it as a Dataflow Flex Template.
Flex Templates are pipelines wrapped in a Docker container. The pipeline can be invoked with the `gcloud dataflow flex-template run` command. Custom parameters can be passed by using the `--parameters` flag.
Running the following will create a dataset with a 9:1 training/evaluation split containing the red, green, and blue spectral bands.
gcloud dataflow flex-template run "sentinel-2-tf-records`date +%Y%m%d-%H%M%S`" \
--template-file-gcs-location "$TEMPLATE_PATH" \
--region "europe-west3" \
--parameters ^~^output_dir="$OUTPUT_BUCKET"~split="9,1"~bands="B02,B03,B04"